Airports & Navigational Intelligence
Camera, sensor and ML model pipelines for measuring passenger attention, dwell, navigation and friction from curb to gate.
From raw airport data to operational intelligence
Lumirithmic brings proven camera, imaging and AI delivery capability, having executed professional-grade solutions and projects for global innovation-led brands including Google and L'Oréal
Airport Inputs
CCTV, sensors, layouts, screens, signage, passenger flows
Lumirithmic Automation
Camera interpretation, event extraction, model orchestration
Model + Tuning
Off-the-shelf and custom built models tuned for airport conditions
Airport Outputs
Attention, dwell, navigation, friction, incident and KPI views
Airports already hold rich spatial data from passenger movement, infrastructure and operations.
For any airport, Lumirithmic automates camera/sensor interpretation, selects suitable CV/ML models, tunes them for the airport environment and exposes configurable outputs. This extracts relevant and contextual behavior intelligence that can be used with agentic AI tooling.
Move beyond crowd counting
- Measure what passengers looked at and for how long.
- Understand how passengers navigate through a space from curb to gate.
- Identify where passengers slow down, hesitate, turn back or cluster.
- Measure whether screens, signage, layouts or operational changes improve movement.
- Support passenger experience, operations, commercial planning and safety use cases.
Technical translation
A configurable camera + sensor ML layer built for attention, dwell, navigation and friction analytics.
Airport inputs and raw sensor data
- Fixed CCTV and overhead camera feeds.
- Lidar, occupancy and spatial sensors where available.
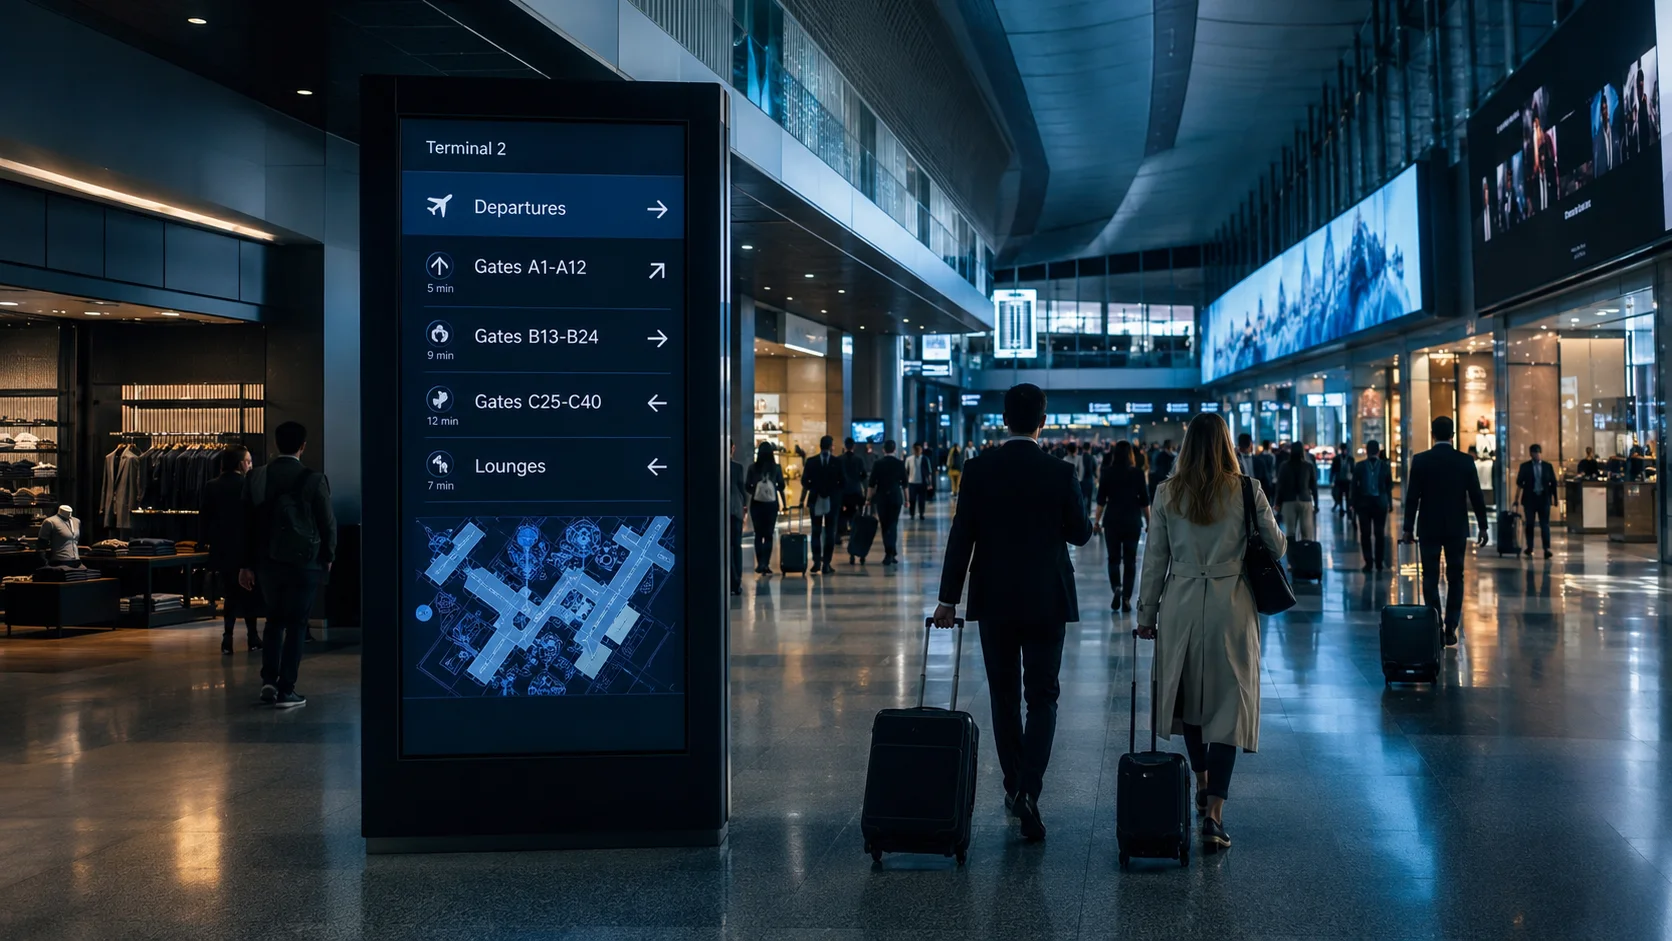
- Digital screen, signage, retail, gate and service-point locations.
- Airport zone maps and curb-to-gate journey layouts.
- Flight waves, intervention dates, peak periods and known disruption windows.
- Optional personnel video sources such as bodycam or smart-glasses footage for review and incident context.
Lumirithmic interpretation of the input data
- Detect passengers, groups, queues, objects, screens, signs, counters and decision zones.
- Track anonymised movement within selected camera views.
- Estimate orientation, dwell, stop-start behaviour, path direction and speed change.
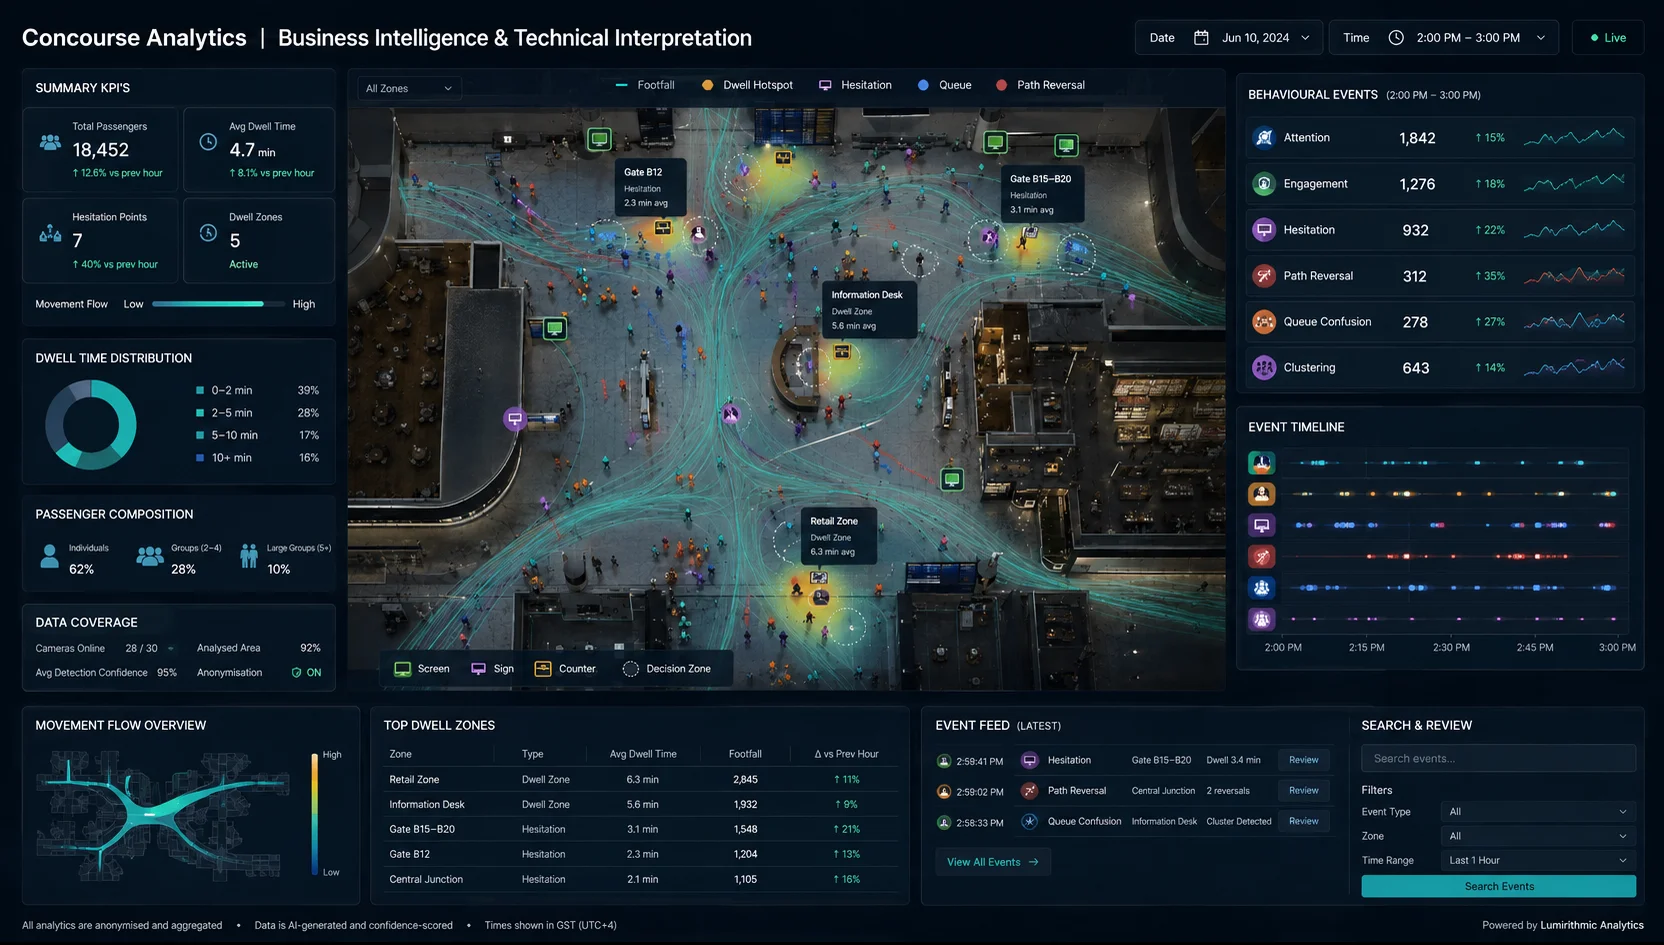
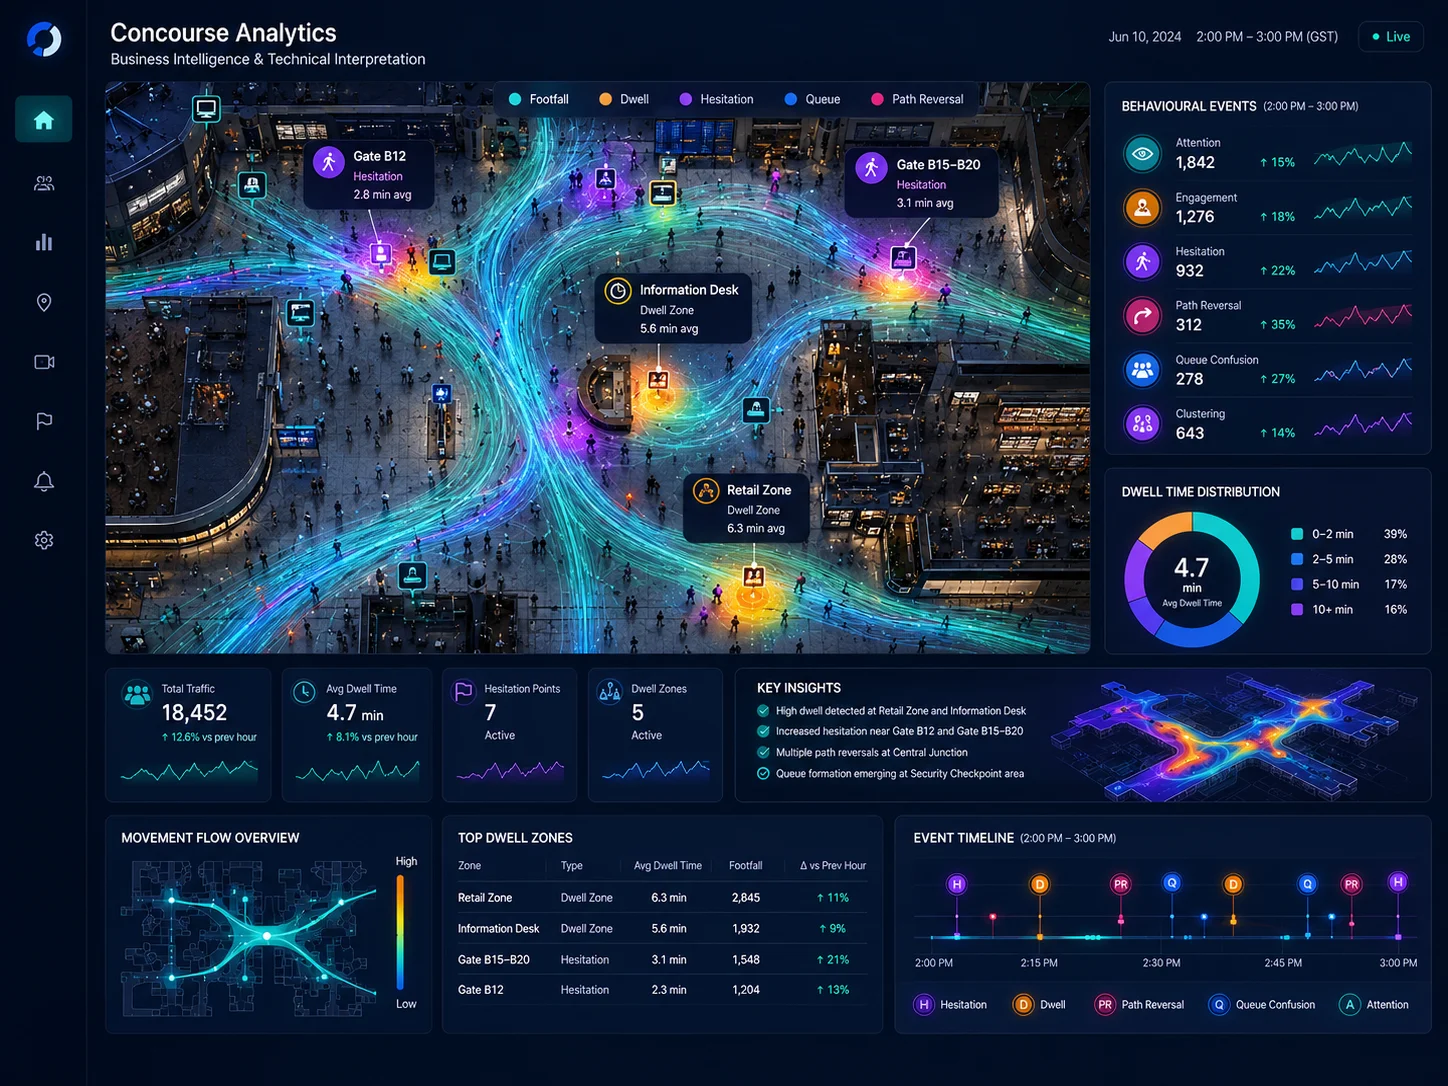
- Extract behavioural events: attention, engagement, hesitation, path reversal, queue confusion and clustering.
- Convert raw footage into structured, timestamped events that can be searched, reviewed and measured.
Tuning Applicable off-the-shelf and custom CV/ML models
Perception Models
- Person, group and object detection
- Named item detection
- Screen, sign and asset localisation
Movement Models
- Multi-object tracking
- Trajectory analysis and clustering
- Queue and crowd clustering
- Path anomaly detection
Behaviour Models
- Pose and orientation estimation
- Dwell and engagement duration
- Temporal behaviour classification
- Video search and summarisation
Custom Perception Improvements
- Reflective/glare surface handling
- Airport-specific object classes
- Cross-frame optical flow tracking
- Configurable alert thresholds
Custom Navigation Tracking
- Cross-camera identity continuity
- Common route clustering
- Editable airport asset map
- Path anomaly flagging
Tuned Behavior Analytics
- Attention & interaction cues
- Glance/dwell monetizable data
- Browsing vs. hesitation vs. queueing
- Timestamped engagement summaries
Agentic operations on a configurable dashboard
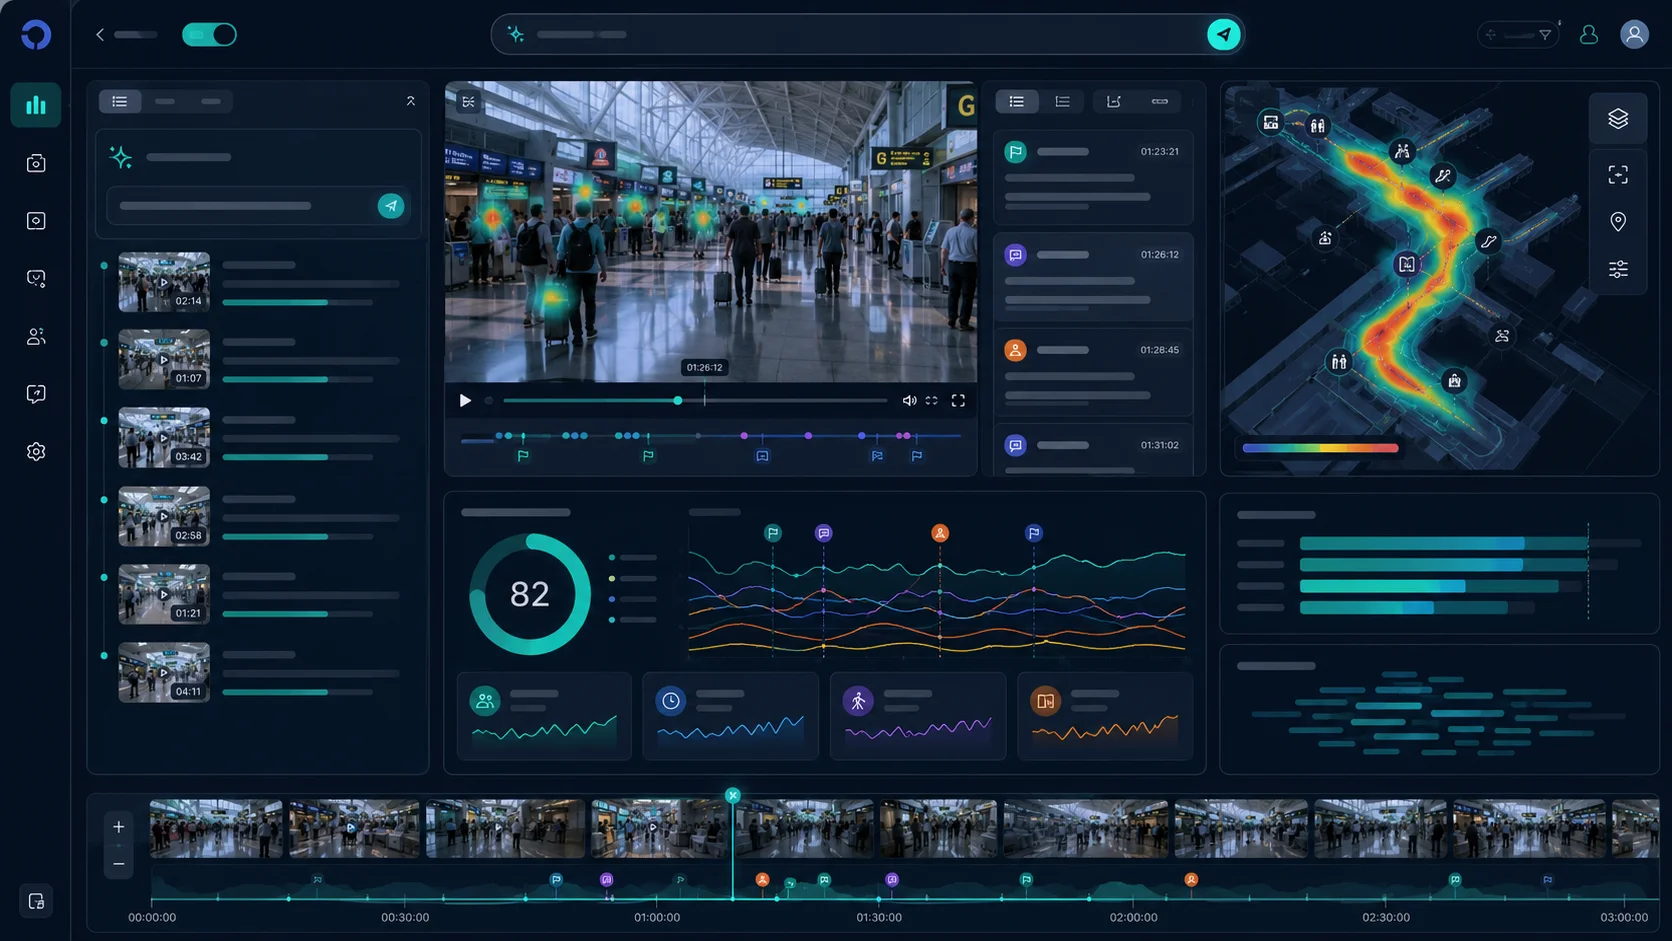
- Combine live video, zone maps, timelines, heatmaps, alerts and analytics in one analyst workspace.
- Jump from a dashboard alert to the exact timestamped video clip, zone location and related camera views.
- Track dwell, congestion, queue build-up, movement paths, hesitation points and abnormal flow patterns.
- Let analysts query footage by time, zone, behaviour, object, incident type or passenger movement pattern.
- Surface the most important events first, such as stalled queues, unusual dwell, unattended objects or restricted-zone activity.
- Export clips, summaries, event logs and metrics for operations reviews, security escalation or service improvement planning.
- Customise dashboard based on operator roles
What we can measure for any airport
Experience
- Attention rate
- Engagement duration
- Hesitation count
- Path reversal rate
- Decision-point delay
Operations
- Flow impact
- Route choice change
- Congestion change
- Manual review reduction
- Compute cost per video hour
Safety
- Unattended-item detection
- Time-to-find incident footage
- Event confidence score
- Camera suitability
- Model reliability
Passenger Interaction KPIs
- Asset visibility
- Hesitation points
- Route delay hotspots
- High-attention zones
- Signage/layout gaps
Passenger Throughput KPIs
- Speed & dwell change
- Path choice shift
- Review time saved
- Processing cost per hour
Passenger Security KPIs
- Flag accuracy
- Time-to-clip
- Event confidence score
- Camera usability
Use Case 1: Incident query
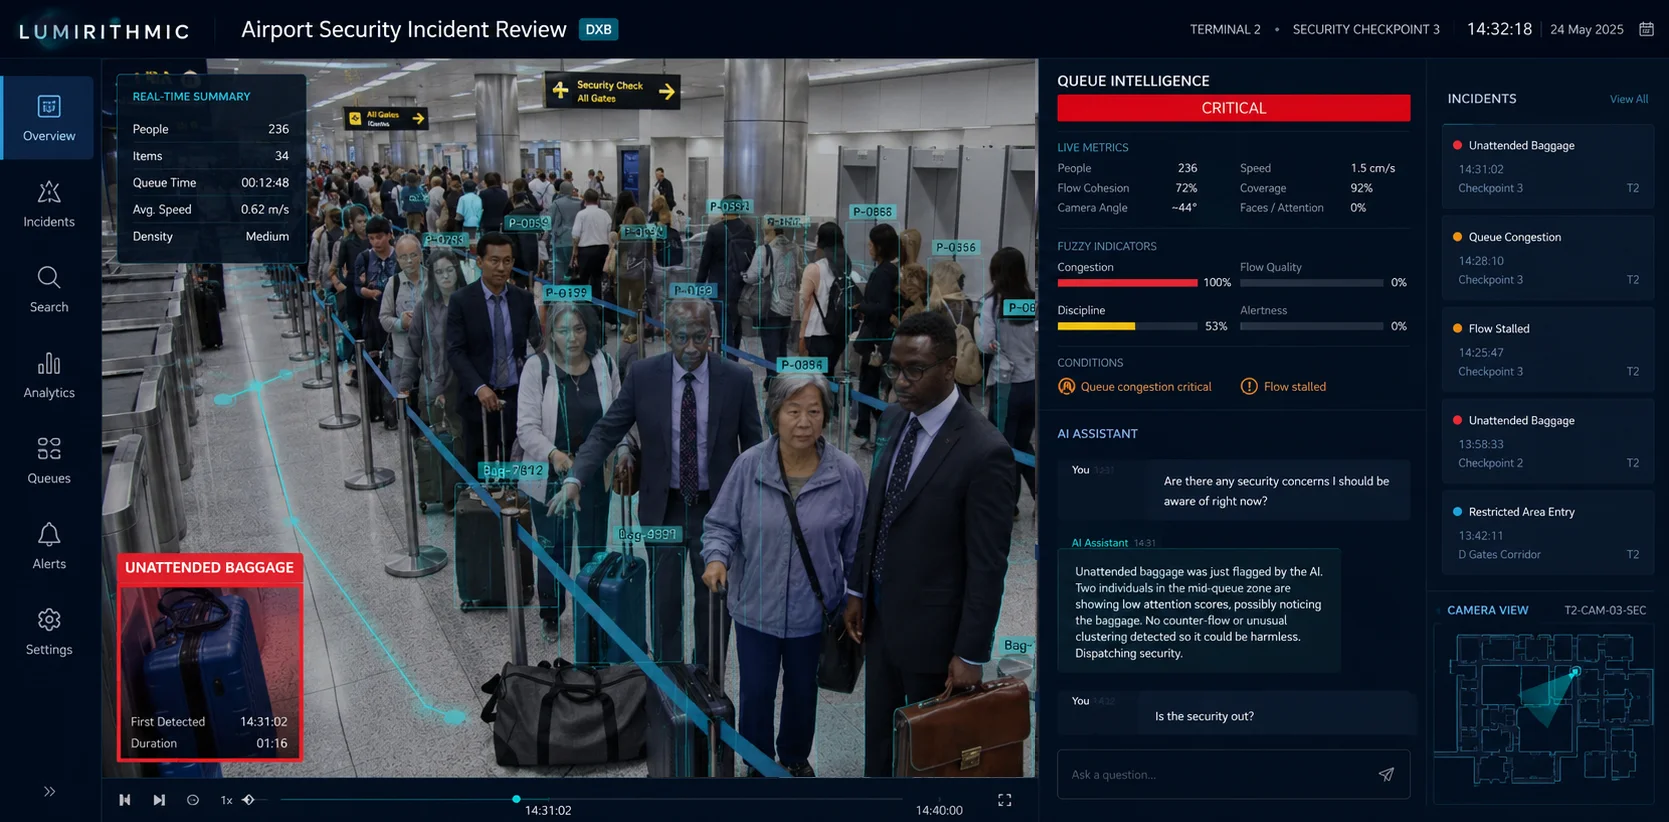
- Detects unattended bags or objects in selected zones using object detection, object permanence and owner-separation logic.
- Monitors person behavior around tagged objects to double check suspected anomalies
- Marks events with timestamp, camera, location, duration and confidence score.
- Links detected events to nearby footage for fast review and escalation.
- Supports natural-language search such as "show unattended item events near Checkpoint 3 between 2pm and 4pm."
- Extends to other incident classes, including crowd surge, person down, restricted-zone entry, blocked exits and queue overflow.
Outcomes
- Faster incident detection
- Reduced manual review time
- Higher escalation accuracy
- Consistent event documentation
Use Case 2: Tray pose detection
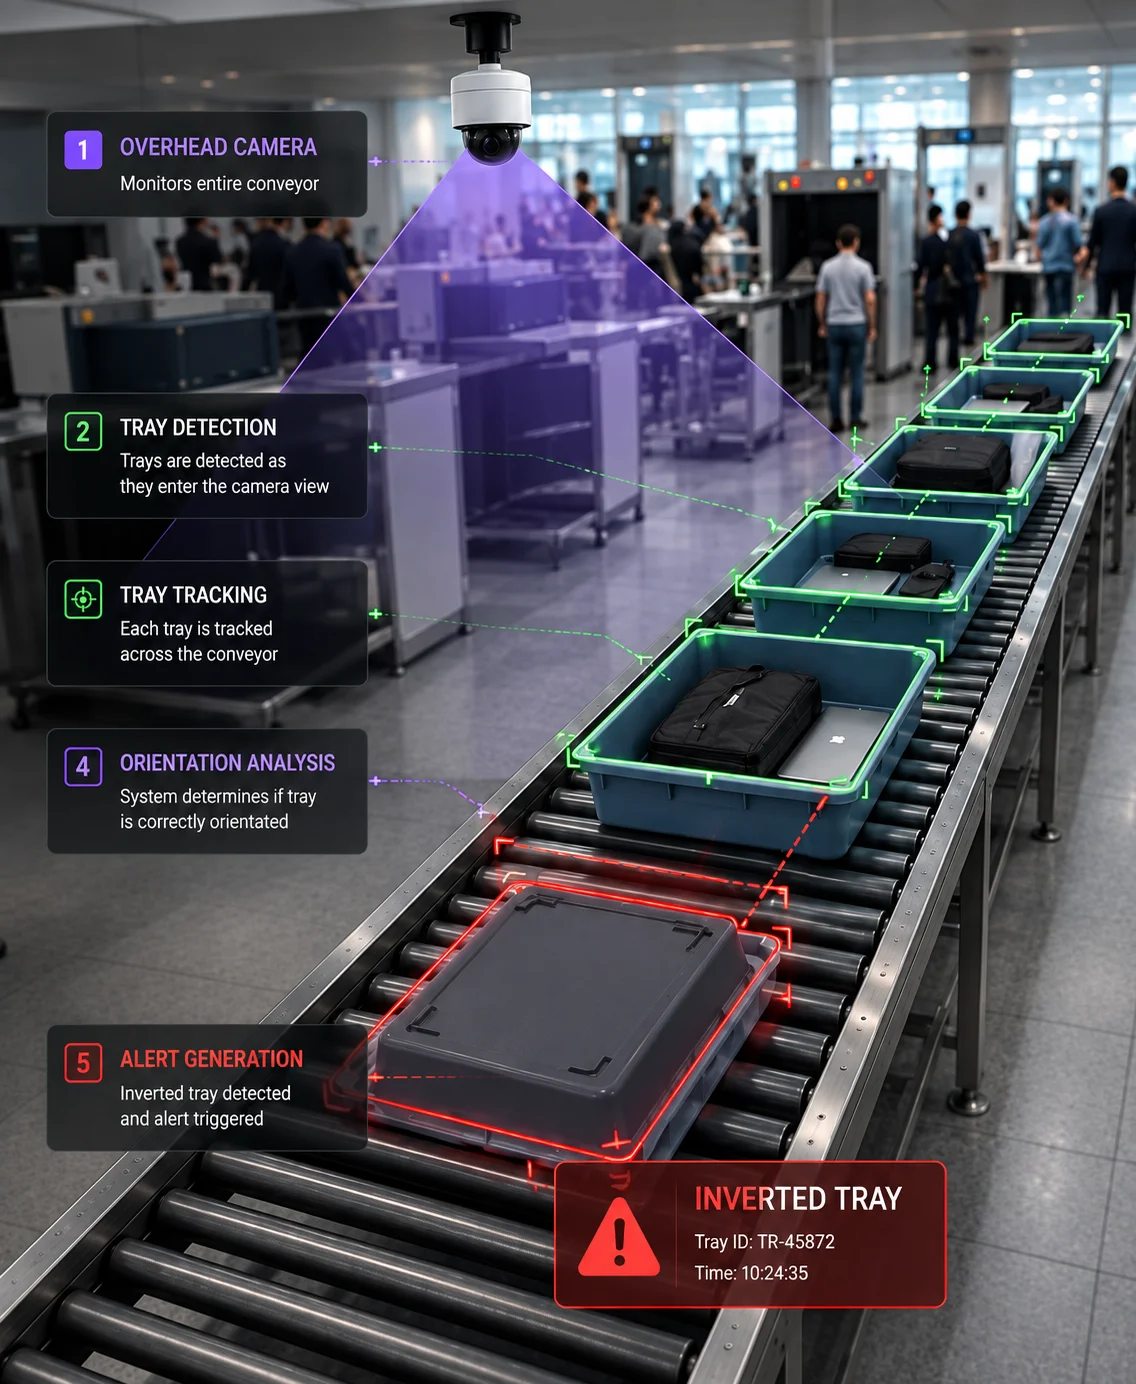
- Single overhead camera observing the conveyor
- Detect trays entering the field of view
- Track each tray across the conveyor
- Determine whether the tray is correctly orientated, inverted or moved
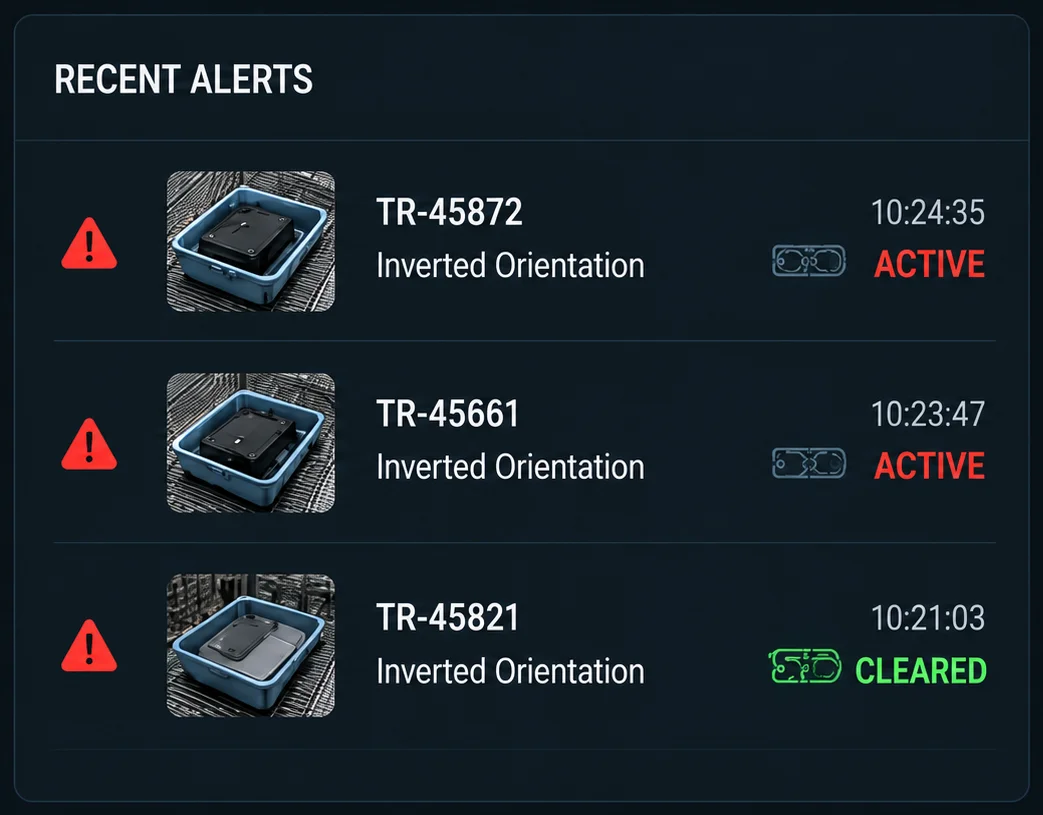
- Trigger a real-time alert for incorrectly orientated trays
- Record detections and operator feedback for continuous model improvement
Outcomes
- Reliable tray detection
- Accurate orientation classification
- Reduce false alarm rate
- Minimal impact on conveyor throughput
Use Case 3: Baggage size detection
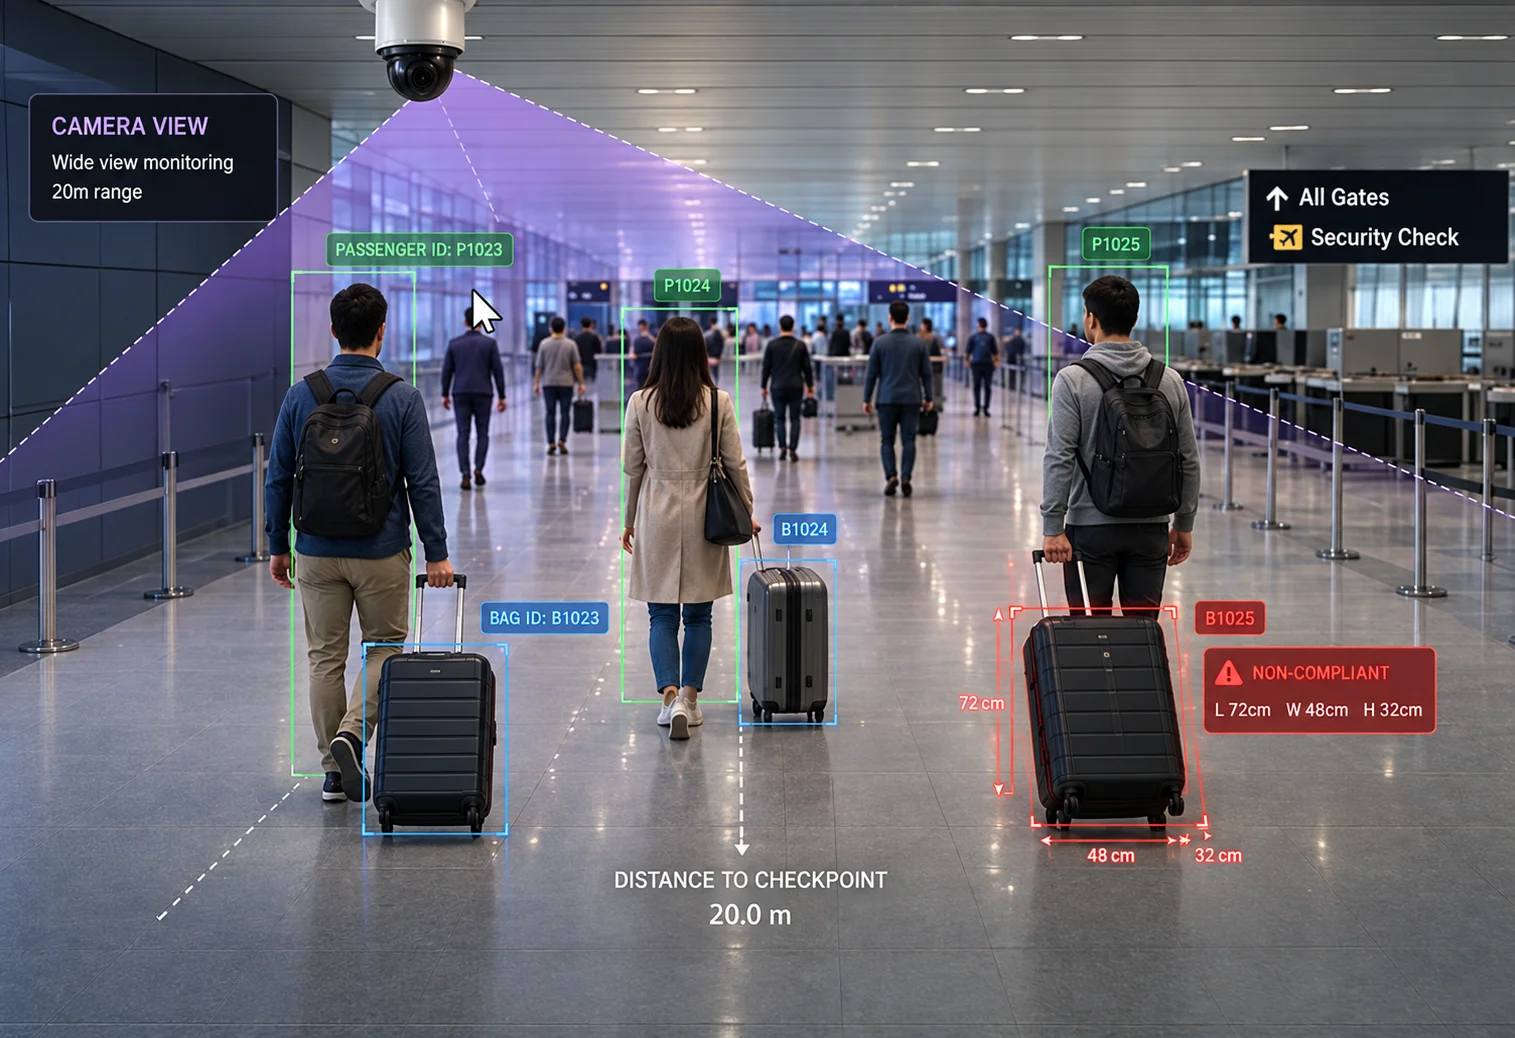
- Observe passengers approaching the checkpoint
- Detect and track each passenger and their associated baggage
- Follow each pairing with its owner throughout the scene
- Estimate bag dimensions against configurable airline limits
- Highlight non-compliant bags before passengers reach the screening point
- Log measurements and operator feedback to continuously improve accuracy
Outcomes
- Reliable bag-to-owner association
- Consistent size estimation
- Early operational notification
- Minimal false positives